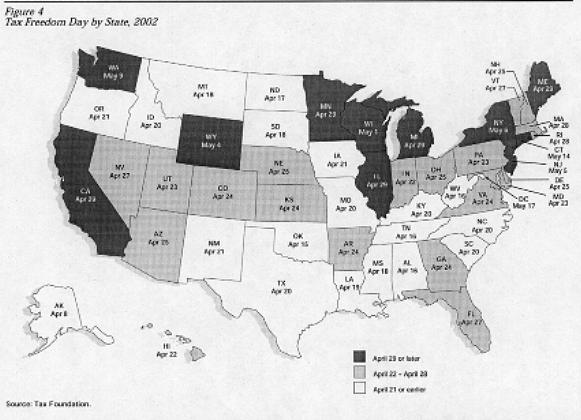
(Sorted by per capita State and Local taxes increasing down the table (column 7). To see this table sorted by increasing State and Local taxes as a percentage of per capita income, click here. "Tax Day" data displayed graphically, click here. Remember, white is relatively good, gray is moderate, and black is relatively bad.)
| State | Average Per Capita Income | Total - Disposable (as a percent of total) |
Per Capita Taxes (2002) | Number of Tax Days | S&L Tax (%) | |||||
|---|---|---|---|---|---|---|---|---|---|---|
| Total | Disposable | Total | Federal | S&L | Total | Federal | S&L | |||
| Alaska | 31,327 | 00000 | 00000 | 8,444 | 6,465 | 1,979 | 98 | 75 | 23 | 6.3 |
| Alabama | 25,313 | 00000 | 00000 | 7,363 | 5,072 | 2,291 | 106 | 73 | 33 | 9.1 |
| Tennessee | 28,039 | 00000 | 00000 | 8,188 | 5,835 | 2,353 | 106 | 76 | 30 | 8.4 |
| Montana | 24,083 | 00000 | 00000 | 7,187 | 4,786 | 2,400 | 108 | 72 | 36 | 10.0 |
| Mississippi | 22,522 | 00000 | 00000 | 6,711 | 4,299 | 2,413 | 108 | 69 | 39 | 10.7 |
| West Virginia | 23,573 | 00000 | 00000 | 6,850 | 4,370 | 2,480 | 106 | 68 | 38 | 10.5 |
| South Dakota | 27,589 | 00000 | 00000 | 8,184 | 5,676 | 2,508 | 108 | 75 | 33 | 9.1 |
| Oklahoma | 25,760 | 00000 | 00000 | 7,466 | 4,909 | 2,556 | 105 | 69 | 36 | 9.9 |
| New Mexico | 23,667 | 00000 | 00000 | 7,204 | 4,634 | 2,570 | 111 | 72 | 39 | 10.9 |
| South Carolina | 25,977 | 00000 | 00000 | 7,837 | 5,238 | 2,599 | 110 | 74 | 36 | 10.0 |
| Louisiana | 24,953 | 00000 | 00000 | 7,500 | 4,869 | 2,631 | 109 | 71 | 38 | 10.5 |
| Idaho | 25,044 | 00000 | 00000 | 7,588 | 4,949 | 2,639 | 110 | 72 | 38 | 10.5 |
| Arkansas | 23,782 | 00000 | 00000 | 7,429 | 4,746 | 2,683 | 114 | 73 | 41 | 11.3 |
| Texas | 30,304 | 00000 | 00000 | 9,206 | 6,480 | 2,726 | 110 | 78 | 32 | 9.0 |
| North Dakota | 26,852 | 00000 | 00000 | 7,910 | 5,177 | 2,733 | 107 | 70 | 37 | 10.2 |
| Kentucky | 26,228 | 00000 | 00000 | 7,924 | 5,161 | 2,763 | 110 | 72 | 38 | 10.5 |
| Arizona | 27,317 | 00000 | 00000 | 8,657 | 5,889 | 2,768 | 115 | 79 | 36 | 10.1 |
| Oregon | 29,443 | 00000 | 00000 | 8,984 | 6,216 | 2,768 | 111 | 77 | 34 | 9.4 |
| Florida | 30,390 | 00000 | 00000 | 9,783 | 6,950 | 2,833 | 117 | 83 | 34 | 9.3 |
| Missouri | 29,347 | 00000 | 00000 | 8,875 | 6,042 | 2,833 | 110 | 75 | 35 | 9.7 |
| Indiana | 28,801 | 00000 | 00000 | 8,909 | 6,059 | 2,850 | 112 | 76 | 36 | 9.9 |
| Utah | 25,468 | 00000 | 00000 | 7,945 | 5,086 | 2,860 | 113 | 73 | 40 | 11.2 |
| Wyoming | 29,228 | 00000 | 00000 | 9,959 | 7,087 | 2,873 | 124 | 89 | 35 | 9.8 |
| North Carolina | 29,324 | 00000 | 00000 | 8,911 | 5,961 | 2,950 | 110 | 74 | 36 | 10.1 |
| Nevada | 32,100 | 00000 | 00000 | 10,374 | 7,418 | 2,956 | 117 | 84 | 33 | 9.2 |
| Iowa | 28,758 | 00000 | 00000 | 8,801 | 5,818 | 2,983 | 111 | 74 | 37 | 10.4 |
| Kansas | 29,666 | 00000 | 00000 | 9,303 | 6,219 | 3,085 | 114 | 77 | 37 | 10.4 |
| Georgia | 30,219 | 00000 | 00000 | 9,499 | 6,413 | 3,086 | 114 | 77 | 37 | 10.2 |
| New Hampshire | 35,951 | 00000 | 00000 | 11,361 | 8,275 | 3,086 | 115 | 84 | 31 | 8.6 |
| Pennsylvania | 32,181 | 00000 | 00000 | 10,018 | 6,844 | 3,174 | 113 | 78 | 35 | 9.9 |
| Colorado | 35,309 | 00000 | 00000 | 11,041 | 7,844 | 3,196 | 114 | 81 | 33 | 9.1 |
| Nebraska | 29,656 | 00000 | 00000 | 9,377 | 6,161 | 3,216 | 115 | 76 | 39 | 10.8 |
| Vermont | 29,455 | 00000 | 00000 | 9,447 | 6,220 | 3,227 | 117 | 78 | 39 | 11.0 |
| Virginia | 34,276 | 00000 | 00000 | 10,712 | 7,483 | 3,228 | 114 | 80 | 34 | 9.4 |
| Hawaii | 28,631 | 00000 | 00000 | 8,860 | 5,537 | 3,323 | 112 | 70 | 42 | 11.6 |
| Michigan | 31,304 | 00000 | 00000 | 10,272 | 6,916 | 3,356 | 119 | 80 | 39 | 10.7 |
| Ohio | 30,128 | 00000 | 00000 | 9,522 | 6,155 | 3,368 | 115 | 75 | 40 | 11.2 |
| Delaware | 33,713 | 00000 | 00000 | 10,692 | 7,265 | 3,427 | 115 | 78 | 37 | 10.2 |
| Illinois | 34,610 | 00000 | 00000 | 11,352 | 7,902 | 3,451 | 119 | 83 | 36 | 10.0 |
| Washington | 33,436 | 00000 | 00000 | 11,899 | 8,401 | 3,498 | 129 | 91 | 38 | 10.5 |
| Maryland | 36,792 | 00000 | 00000 | 11,425 | 7,859 | 3,566 | 113 | 78 | 35 | 9.7 |
| Maine | 27,900 | 00000 | 00000 | 9,115 | 5,533 | 3,582 | 119 | 73 | 46 | 12.8 |
| California | 34,924 | 00000 | 00000 | 11,417 | 7,832 | 3,585 | 119 | 82 | 37 | 10.3 |
| Rhode Island | 31,816 | 00000 | 00000 | 10,352 | 6,763 | 3,589 | 118 | 77 | 41 | 11.3 |
| Wisconsin | 30,554 | 00000 | 00000 | 10,156 | 6,500 | 3,656 | 121 | 78 | 43 | 12.0 |
| Massachusetts | 41,438 | 00000 | 00000 | 13,489 | 9,565 | 3,924 | 118 | 84 | 34 | 9.5 |
| Minnesota | 34,879 | 00000 | 00000 | 11,466 | 7,530 | 3,936 | 119 | 78 | 41 | 11.3 |
| New Jersey | 40,258 | 00000 | 00000 | 13,805 | 9,659 | 4,146 | 125 | 88 | 37 | 10.3 |
| New York | 37,902 | 00000 | 00000 | 13,163 | 8,515 | 4,648 | 126 | 82 | 44 | 12.3 |
| Connecticut | 44,990 | 00000 | 00000 | 16,521 | 11,615 | 4,906 | 134 | 95 | 39 | 10.9 |
| D.C. | 42,366 | 00000 | 00000 | 15,920 | 10,026 | 5,894 | 137 | 87 | 50 | 13.9 |
Footnotes:
Per capita personal income data from Bureau of Economic Analysis (Dept. of Commerce) for 2001 see http://www.economagic.com/beapira.htm
"Tax Days" is number of days in the year devoted to paying the respective tax (Federal or State and Local). Per capita tax data and State and Local (S&L) tax day data are from The Tax Foundation (see www.TaxFoundation.org). "S&L Tax(%)" is state and local taxes as a percent of per capita income.