Disposable income figures coming soon.
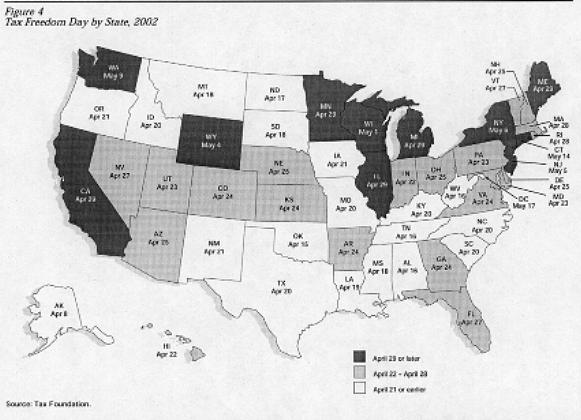
(Sorted by State and Local taxes as a percentage of per capita income (last column), increasing down the table. To see this table sorted by increasing State and Local taxes, click here. "Tax Day" data displayed graphically, click here. Remember, white is relatively good, gray is moderate, and black is relatively bad.)
| State | Average Per Capita Income | Total - Disposable (as a percent of total) |
Per Capita Taxes (2002) | Number of Tax Days | S&L Tax (%) | |||||
|---|---|---|---|---|---|---|---|---|---|---|
| Total | Disposable | Total | Federal | S&L | Total | Federal | S&L | |||
| Alaska | 31,327 | 00000 | 00000 | 8,444 | 6,465 | 1,979 | 98 | 75 | 23 | 6.3 |
| Tennessee | 28,039 | 00000 | 00000 | 8,188 | 5,835 | 2,353 | 106 | 76 | 30 | 8.4 |
| New Hampshire | 11,361 | 00000 | 00000 | 11,361 | 8,275 | 3,086 | 115 | 84 | 31 | 8.6 |
| Texas | 30,304 | 00000 | 00000 | 9,206 | 6,480 | 2,726 | 110 | 78 | 32 | 9.0 |
| Alabama | 25,313 | 00000 | 00000 | 7,363 | 5,072 | 2,291 | 106 | 73 | 33 | 9.1 |
| Colorado | 35,309 | 00000 | 00000 | 11,041 | 7,844 | 3,196 | 114 | 81 | 33 | 9.1 |
| South Dakota | 27,589 | 00000 | 00000 | 8,184 | 5,676 | 2,508 | 108 | 75 | 33 | 9.1 |
| Nevada | 32,100 | 00000 | 00000 | 10,374 | 7,418 | 2,956 | 117 | 84 | 33 | 9.2 |
| Florida | 30,390 | 00000 | 00000 | 9,783 | 6,950 | 2,833 | 117 | 83 | 34 | 9.3 |
| Oregon | 29,443 | 00000 | 00000 | 8,984 | 6,216 | 2,768 | 111 | 77 | 34 | 9.4 |
| Virginia | 34,276 | 00000 | 00000 | 10,712 | 7,483 | 3,228 | 114 | 80 | 34 | 9.4 |
| Massachusetts | 41,438 | 00000 | 00000 | 13,489 | 9,565 | 3,924 | 118 | 84 | 34 | 9.5 |
| Maryland | 36,792 | 00000 | 00000 | 11,425 | 7,859 | 3,566 | 113 | 78 | 35 | 9.7 |
| Missouri | 29,347 | 00000 | 00000 | 8,875 | 6,042 | 2,833 | 110 | 75 | 35 | 9.7 |
| Wyoming | 29,228 | 00000 | 00000 | 9,959 | 7,087 | 2,873 | 124 | 89 | 35 | 9.8 |
| Indiana | 28,801 | 00000 | 00000 | 8,909 | 6,059 | 2,850 | 112 | 76 | 36 | 9.9 |
| Oklahoma | 25,760 | 00000 | 00000 | 7,466 | 4,909 | 2,556 | 105 | 69 | 36 | 9.9 |
| Pennsylvania | 32,181 | 00000 | 00000 | 10,018 | 6,844 | 3,174 | 113 | 78 | 35 | 9.9 |
| Illinois | 34,610 | 00000 | 00000 | 11,352 | 7,902 | 3,451 | 119 | 83 | 36 | 10.0 |
| Montana | 24,083 | 00000 | 00000 | 7,187 | 4,786 | 2,400 | 108 | 72 | 36 | 10.0 |
| South Carolina | 25,977 | 00000 | 00000 | 7,837 | 5,238 | 2,599 | 110 | 74 | 36 | 10.0 |
| Arizona | 27,317 | 00000 | 00000 | 8,657 | 5,889 | 2,768 | 115 | 79 | 36 | 10.1 |
| North Carolina | 29,324 | 00000 | 00000 | 8,911 | 5,961 | 2,950 | 110 | 74 | 36 | 10.1 |
| Delaware | 33,713 | 00000 | 00000 | 10,692 | 7,265 | 3,427 | 115 | 78 | 37 | 10.2 |
| Georgia | 30,219 | 00000 | 00000 | 9,499 | 6,413 | 3,086 | 114 | 77 | 37 | 10.2 |
| North Dakota | 26,852 | 00000 | 00000 | 7,910 | 5,177 | 2,733 | 107 | 70 | 37 | 10.2 |
| California | 34,924 | 00000 | 00000 | 11,417 | 7,832 | 3,585 | 119 | 82 | 37 | 10.3 |
| New Jersey | 40,258 | 00000 | 00000 | 13,805 | 9,659 | 4,146 | 125 | 88 | 37 | 10.3 |
| Iowa | 28,758 | 00000 | 00000 | 8,801 | 5,818 | 2,983 | 111 | 74 | 37 | 10.4 |
| Kansas | 29,666 | 00000 | 00000 | 9,303 | 6,219 | 3,085 | 114 | 77 | 37 | 10.4 |
| Idaho | 25,044 | 00000 | 00000 | 7,588 | 4,949 | 2,639 | 110 | 72 | 38 | 10.5 |
| Kentucky | 26,288 | 00000 | 00000 | 7,924 | 5,161 | 2,763 | 110 | 72 | 38 | 10.5 |
| Louisiana | 24,953 | 00000 | 00000 | 7,500 | 4,869 | 2,631 | 109 | 71 | 38 | 10.5 |
| West Virginia | 23,573 | 00000 | 00000 | 6,850 | 4,370 | 2,480 | 106 | 68 | 38 | 10.5 |
| Washington | 33,436 | 00000 | 00000 | 11,899 | 8,401 | 3,498 | 129 | 91 | 38 | 10.5 |
| Michigan | 31,304 | 00000 | 00000 | 10,272 | 6,916 | 3,356 | 119 | 80 | 39 | 10.7 |
| Mississippi | 22,522 | 00000 | 00000 | 6,711 | 4,299 | 2,413 | 108 | 69 | 39 | 10.7 |
| Nebraska | 29,656 | 00000 | 00000 | 9,377 | 6,161 | 3,216 | 115 | 76 | 39 | 10.8 |
| Connecticut | 44,990 | 00000 | 00000 | 16,521 | 11,615 | 4,906 | 134 | 95 | 39 | 10.9 |
| New Mexico | 23,667 | 00000 | 00000 | 7,204 | 4,634 | 2,570 | 111 | 72 | 39 | 10.9 |
| Vermont | 29,455 | 00000 | 00000 | 9,447 | 6,220 | 3,227 | 117 | 78 | 39 | 11.0 |
| Ohio | 30,128 | 00000 | 00000 | 9,522 | 6,155 | 3,368 | 115 | 75 | 40 | 11.2 |
| Utah | 25,468 | 00000 | 00000 | 7,945 | 5,086 | 2,860 | 113 | 73 | 40 | 11.2 |
| Arkansas | 23,782 | 00000 | 00000 | 7,429 | 4,746 | 2,683 | 114 | 73 | 41 | 11.3 |
| Minnesota | 34,879 | 00000 | 00000 | 11,466 | 7,530 | 3,936 | 119 | 78 | 41 | 11.3 |
| Rhode Island | 31,816 | 00000 | 00000 | 10,352 | 6,763 | 3,589 | 118 | 77 | 41 | 11.3 |
| Hawaii | 28,631 | 00000 | 00000 | 8,860 | 5,537 | 3,323 | 112 | 70 | 42 | 11.6 |
| Wisconsin | 30,554 | 00000 | 00000 | 10,156 | 6,500 | 3,656 | 121 | 78 | 43 | 12.0 |
| New York | 37,902 | 00000 | 00000 | 13,163 | 8,515 | 4,648 | 126 | 82 | 44 | 12.3 |
| Maine | 27,900 | 00000 | 00000 | 9,115 | 5,533 | 3,582 | 119 | 73 | 46 | 12.8 |
| D.C. | 42,366 | 00000 | 00000 | 15,920 | 10,026 | 5,894 | 137 | 87 | 50 | 13.9 |
Footnotes:
Per capita personal disposable income data from Bureau of Economic Analysis (Dept. of Commerce) for 2001 see http://www.economagic.com/beapira.htm
"Tax Days" is number of days in the year devoted to paying the respective tax (Federal or State and Local). Per capita tax data and State and Local (S&L) tax day data are from The Tax Foundation (see www.TaxFoundation.org). "S&L Tax(%)" is state and local taxes as a percent of per capita income.